
Today, the Organisation for Economic Co-operation and Development (OECD) released results from the Programme for International Student Assessment (PISA). PISA is a triennial international survey which aims to evaluate education systems worldwide by testing the skills and knowledge of 15-year-old students. In 2015, over half a million students in 72 countries and economies were assessed in science, mathematics and reading.
Just as in the recently released TIMSS results, Singapore led the world in every subject, outperforming other economies and countries by a significant margin, with mean scores of 556, 564 and 535 in science, math and reading.
Other top-performing economies in science include Japan, Estonia, Chinese Taipei and Finland. Other top-performing economies in math include Hong Kong (China), Macao (China), Chinese Taipei and Japan. Other top-performers in reading include Canada, Hong Kong (China), Finland and Ireland.
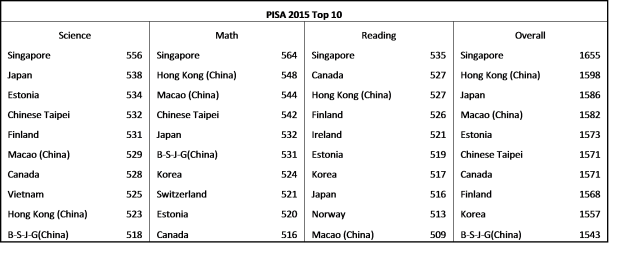
Vietnam continues to perform very well, especially in science, managing to enter the top 10, just below Canada and above Hong Kong and the four Chinese provinces and cities (Beijing, Shanghai, Jiangsu and Guangdong).
Since the first round in 2000, no country has improved more than Peru: 64 points in science, 95 in math and 71 in reading. Between 2000 and 2012, the following countries have recorded the highest increase in science scores:
| Peru | 64 | 333 to 397 |
| Albania | 51 | 376 to 427 |
| Portugal | 42 | 459 to 501 |
| Luxembourg | 40 | 443 to 483 |
| Israel | 33 | 434 to 467 |
| Chile | 32 | 415 to 447 |
| Latvia | 30 | 460 to 490 |
| Russia | 27 | 460 to 487 |
| Brazil | 26 | 375 to 401 |
| Germany | 22 | 487 to 509 |
In math:
| Peru | 95 | 292 to 387 |
| Brazil | 43 | 334 to 377 |
| Luxembourg | 40 | 446 to 486 |
| Chile | 39 | 384 to 423 |
| Portugal | 38 | 454 to 492 |
| Israel | 37 | 433 to 470 |
| Poland | 34 | 470 to 504 |
| Italy | 33 | 457 to 490 |
| Albania | 32 | 381 to 413 |
| Mexico | 21 | 387 to 408 |
In reading:
| Peru | 71 | 327 to 398 |
| Albania | 56 | 349 to 405 |
| Chile | 49 | 410 to 459 |
| Luxembourg | 40 | 441 to 481 |
| Russia | 33 | 462 to 495 |
| Latvia | 30 | 458 to 488 |
| Portugal | 28 | 470 to 498 |
| Poland | 27 | 479 to 506 |
| Israel | 27 | 452 to 479 |
| Indonesia | 26 | 371 to 397 |
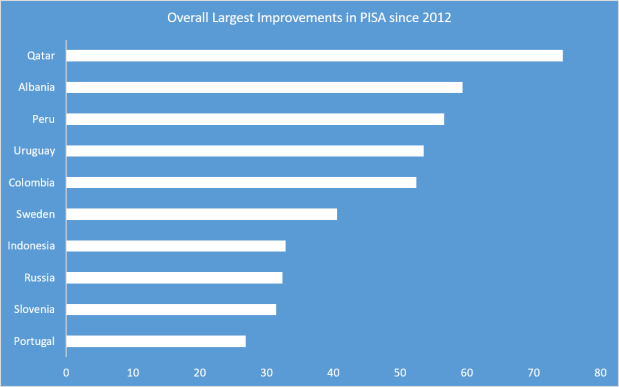
Since the last round of PISA, in 2012, these countries witnessed the biggest improvements:
| Science | Math | Reading | |||
| Qatar | 34 | Qatar | 26 | Uruguay | 26 |
| Albania | 30 | Peru | 19 | Slovenia | 24 |
| Peru | 24 | Albania | 19 | Colombia | 22 |
| Indonesia | 21 | Sweden | 16 | Russia | 20 |
| Uruguay | 19 | Colombia | 14 | Chile | 18 |
| Colombia | 17 | Norway | 13 | Sweden | 17 |
| Portugal | 12 | Russia | 12 | Qatar | 14 |
| Chinese Taipei | 9 | Denmark | 11 | Peru | 14 |
| Macao (China) | 8 | Indonesia | 11 | Albania | 11 |
| Sweden | 8 | Slovenia | 9 | Portugal | 10 |
Kazakhstan and Malaysia improved significantly as well – in science 31 and 23 points, in math 28 and 25 points, in reading 34 and 33 points. But their scores come with footnotes since “overage is too small to ensure comparability,” according to the OECD. Nevertheless, these gains are impressive in such a short time, not only in Kazakhstan and Malaysia, but also in Albania, Colombia, Peru, Slovenia, Qatar and Uruguay. Overall the biggest improvements occurred in Qatar, Albania and Peru:
These are impressive gains and testimony to the great efforts that teachers, students and parents put into learning every day. They are also inspiring because they show that improvement happens in rich and poor countries, throughout the world. This is true for the PISA results presented here today and for the TIMSS 2015 results released late November.
The rich data that underlies these indicators will allow policy makers and researchers to analyze education systems. A lot can be learned, but it must be through rigorous analysis of the data. As Henry Levin put it, PISA is “not a statistical study that isolates cause and effect.” But modeling and hypothesis testing can help show causal effects, as was done with Poland’s PISA data.
Follow Harry Anthony Patrinos on Twitter at @hpatrinos.
